FL trend analysis
as understood by dave_b_quick
NOTE: The concepts presented here are the intellectual property
of Martin Rosenthal, here referred to as 'FL,' and may not be copied, sold or
used commercially in any way without his permission.
NOTE: My current version of the dot
trend rule discussed here is posted here.
-dbq
There are lots of trend definitions
kicking around, but FL's is special. It uses no lagging indicators, so it's
able to identify trend changes early and stick with them to the end. This is
accomplished by a unique type of wave analysis done on a swing-chart kept by
hand on paper. [image] The
theory is based on extensive research done at MIT while FL was a fund manager.
The results showed that the only thing predictable about market price action
is its tendency to trend, and that prices always move in waves. FL's trend definition
is designed to make it easy for a trend to start, but hard for it to end. Although
simple, the rules are objective so they provide a basis for decisive action.
This document will explain all the elements needed to determine the market trend
for trading purposes.
Because the method makes it easy
to start a new trend, but hard to end the old one, a new trend is considered
to start before the old trend has ended. This results in a dual trend condition
during periods of trend change. This has a couple of benefits. First, the dominant
trend will persist during minor retracements. Second, the areas of dual trend
provide a basis for excellent trades in both directions during times of trend
ambiguity until a dominant trend prevails. This concept may seem difficult at
first, but it will soon be clear. All examples are based on 3-minute bar charts
of e-mini SP500 futures. The method is the same for any market, although for
thinner markets you may use 15-minute bars.
The only tool needed is charting
software capable of displaying a volatility stop set to 9 bars, 2.5 multiplier,
applied to a 3-minute bar chart. We will call it the v-stop for short, or VS.
[image] This is not used as a
stop but as a way to define when one wave ends and another starts, so there
is no subjectivity in defining the waves. Every time the v-stop flips from long
to short or from short to long a new line is added to the hand-chart. The horizontal
lines on the hand chart record the highest price that occurred while the v-stop
was long or the lowest price that occurred while the v-stop was short. Although
not necessary for daytrading, the same v-stop applied to the daily chart is
a useful guide for position trading and for staying in tune with the bigger
trend.
The hand chart shows an endless series
of up-waves and down-waves. The trend is determined by comparing the high of
each wave with the high of the previous wave and by comparing the low of each
wave with low of the the previous wave. 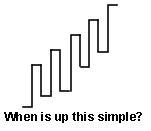 As
we discuss the details of determining trend by comparing highs and lows, don't
forget that we aren't talking about just any high or low. For our purposes we
are only discussing the highs and lows that are recorded on the hand-kept swing
chart. There is no shortcut to skip doing this by hand. It only takes a few
minutes a day, and the discipline of doing it in real-time has a fringe benefit
as an excellent aid to stay engaged and focused on what's most important.
In an idealized up-trend prices would
go up in a series of higher highs and higher lows like stair steps, but when
was it ever that simple? Every up-trend will sooner or later make a lower low
(LL). This does not necessarily mean the trend is over. In fact, in FL's analysis
a LL in an up-trend is called a "powerbuy." 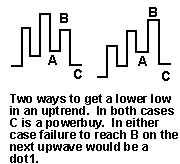 Entry
triggers for trading a powerbuy will be discussed elsewhere. For this discussion
we're only interested in the powerbuy for its importance in determining trend.
There are two ways a powerbuy can
occur, either as a traditional ABC retracement with a lower high followed by
a lower low or directly after a higher high. Either is equally valid. Powerbuys
get their power because a lower low in an up-trend represents an oversold condition.
If the up-trend is intact, the powerbuy will reach new highs. If it fails to
reach a new high, turning down before reaching the level of the previous swing
at B, the lower high that is formed is considered the start of a new downtrend.
The turning point is called a "dot1" or "dot1 down" (to
distinguish it from the higher low at the beginning of an uptrend which is also
called "dot1" or "dot1 up"). 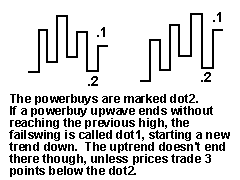
Here's a summary. The powerbuy is
a lower low in an uptrend. If the uptrend is to continue, the powerbuy should
lead to new highs. If the powerbuy fails to make a new high, the lower high
(LH) that results is called dot1, and will be assumed to be the beginning of
a new down-trend. The dot1 starts a new trend but, and this is very important,
the dot1 does not end the old trend. So if a powerbuy ends in a dot1, there
are now two trends in effect. If price immediately drops 3 points below the
low that made the powerbuy, the old up-trend ends there. This may not happen
right away, or at all, and a dual trend may continue for some time. The dual
trend condition can provide excellent opportunities to trade long and short,
as you will soon see.
Here's another quick review. In FL's
method there are 3 possible trends: up, down, or dual. The dominant trend becomes
the only trend three points below a failed powerbuy (or 3 points above a failed
powersell, we'll get to that in a minute). 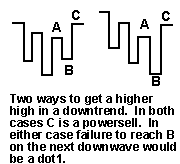 Don't
bother measuring 3 points below a powerbuy that is successful in making new
highs, because, if you read carefully above, before a new trend direction can
be considered a powerbuy must fail to make a new high, forming a dot1. This
may seem too simple, but if you examine a bunch of trend changes you'll soon
conclude for yourself that a trend has never, will never, can never change without
a powerbuy failing to make new highs or a powersell failing to make new lows.
If you do your homework you will soon appreciate the simplicity, elegance, power,
completeness and timeliness of this definition of trend change.
You may have guessed the definition
of a powersell already. It's the exact opposite of the powerbuy in every respect.
A powersell is simply a higher high (HH) in a downtrend. 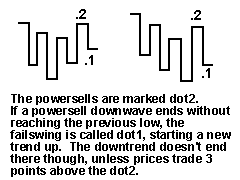 This
can happen in either of the 2 configurations as in the powerbuy. If the downtrend
continues, the powersell will make new lows, often with vigor because of the
overbought condition represented by a HH in a downtrend. If the powersell fails
to make new lows, that is a dot1 up, the beginning of a new uptrend. Remember
that the dot1 starts a new trend but doesn't end the old trend, so starting
at the dot1 there are two trends in effect. The dual trend condition continues
until prices move 3 points above the failed powersell.
Definitions:
Dot1: The failswing where a powerbuy fails to make a new high, or where
a powersell fails to make a new low. The dot1 is considered the start of a new
trend direction, but it does not end the old trend direction. The old trend
direction ends only if prices move 3 points above the failed powersell or below
the failed powerbuy. So you can conclude that wherever you see a dot1, a dual
trend will be in effect from that point.
Dot2: A generic name for a
powertrade, either powerbuy or powersell. Dot2 refers to
the swing point that forms the powerbuy or powersell for wave analysis purposes.
Double top or Double bottom:
is considered a failswing
Dual Trend: This is the trend
condition that exists between the time a new trend starts and the old trend
ends. The new trend starts at a dot1, when a powertrade fails to reach its objective.
The old trend ends 3 points past a failed powertrade. When dual trends are in
effect every higher high is a powersell and every lower low is a powerbuy.
Failswing: Also "failed
swing," or FS. This is any wave which fails to reach the previous
swing. A HL or a LH is a FS. A dot1 is a specific type of FS( see definition
above). A failswing may be with the trend (e.g. HL in an uptrend), or against
the trend (e.g. LH in an uptrend).
LL: A lower low on
the hand-chart which records waves defined by flips of the volatility stop (9/2.5)
on the 3-minute chart.
HH: A higher high on
the hand-chart which records waves defined by flips of the volatility stop (9/2.5)
on the 3-minute chart.
Powertrade: A powerbuy
or powersell, also called dot2
Powerbuy: A lower low in an
uptrend (or in dual trend). The power comes from 2 sources. First, it's oversold
in an uptrend. Second, it's a place where breakdown players who are bucking
the trend get faked out and go short. As they get stopped out it's extra fuel
for the long side.
Powersell: A higher high in
a downtrend (or in dual trend). The power comes from 2 sources. First, it's
overbought in a downtrend. Second, it's a place where breakout players who are
bucking the trend get faked out and go long. As they get stopped out it's extra
fuel for the short side.
Swing: also Swing Low
or Swing High. A wave in price action or a turning point in price action
as in the top or bottom of a wave in price action. For dot trend analysis the
swings under examination are the highs and lows of waves defined by the volatility
stop.
Volatility stop: Called v-stop
for short or VS. A line drawn automatically by the charting software
above or below the market prices. It is like the parabolic stop in that the
line is below when prices are trending up and flips above when prices are moving
down, but is calculated differently from the parabolic stop. The lines are calculated
as follows:
Long: [highest price] - [2.5 x (average range of the last 9 bars)]
Short: [lowest price] + [2.5 x (average range of the last 9 bars)]
Only one line is displayed at a time. If long, the line flips to short on bar
close below the v-stop line. If short, the line flips to long on bar close above
the v-stop line. Not all charting softwares include the v-stop. EnsignSoftware
has had it for decades.
Wave: For dot trend analysis
a wave is considered to end when the volatility stop flips. This definition
is better than traditional kagi or point & figure waves which used a fixed
retracement value, because the volatility stop adapts to current volatility.
Mathematically, a wave ends when price has retraced 2.5 times the ATR of the
last 9 bars, applied from bar close. The top of a wave is the highest price
traded during an up-wave of the volatility stop. The bottom of a wave is the
lowest price traded during a down-wave of the volatility stop.
 As
we discuss the details of determining trend by comparing highs and lows, don't
forget that we aren't talking about just any high or low. For our purposes we
are only discussing the highs and lows that are recorded on the hand-kept swing
chart. There is no shortcut to skip doing this by hand. It only takes a few
minutes a day, and the discipline of doing it in real-time has a fringe benefit
as an excellent aid to stay engaged and focused on what's most important.

 Don't
bother measuring 3 points below a powerbuy that is successful in making new
highs, because, if you read carefully above, before a new trend direction can
be considered a powerbuy must fail to make a new high, forming a dot1. This
may seem too simple, but if you examine a bunch of trend changes you'll soon
conclude for yourself that a trend has never, will never, can never change without
a powerbuy failing to make new highs or a powersell failing to make new lows.
If you do your homework you will soon appreciate the simplicity, elegance, power,
completeness and timeliness of this definition of trend change.
 This
can happen in either of the 2 configurations as in the powerbuy. If the downtrend
continues, the powersell will make new lows, often with vigor because of the
overbought condition represented by a HH in a downtrend. If the powersell fails
to make new lows, that is a dot1 up, the beginning of a new uptrend. Remember
that the dot1 starts a new trend but doesn't end the old trend, so starting
at the dot1 there are two trends in effect. The dual trend condition continues
until prices move 3 points above the failed powersell.